If you build serverless applications, here’s a serverless-specific IDE setup that will help you streamline your workflow.
Over the past few years, I’ve been fortunate enough to work exclusively on serverless tooling.
During that time, I put together a certain workflow that integrates quite nicely with my IDE of choice: WebStorm. And I recently thought to myself, “Oh, I bet lots of other serverless devs out there might find this useful!”
So here it is. In this post, I’d like to share with you my serverless-specific IDE setup, and how it can massively accelerate your serverless workflow.
We will cover:
- creating a brand new serverless project
- linters
- Live Templates (to integrate keyboard shortcuts for the Serverless Framework)
- ways to streamline testing and debugging
Getting started
If you haven’t already, install the Serverless Framework: npm install serverless -g, and type serverless login to create your Platform account.
Then, create a new project using the aws-nodejs template: serverless create -t aws-nodejs.
You’ll also need to download and install WebStorm.
Streamline your serverless workflow
Now that the basics are out of the way, we’re going to talk about the four key WebStorm features I use to help me code (and debug) even faster.
Step 1: set up a linter
A linter is a must-have during any coding session, especially when it’s integrated to your IDE. It provides instant feedback on any typos that you might have missed, saving you tons of time correcting basic errors.
Here’s the kind of feedback WebStorm provides for you once you’ve set up your linter:
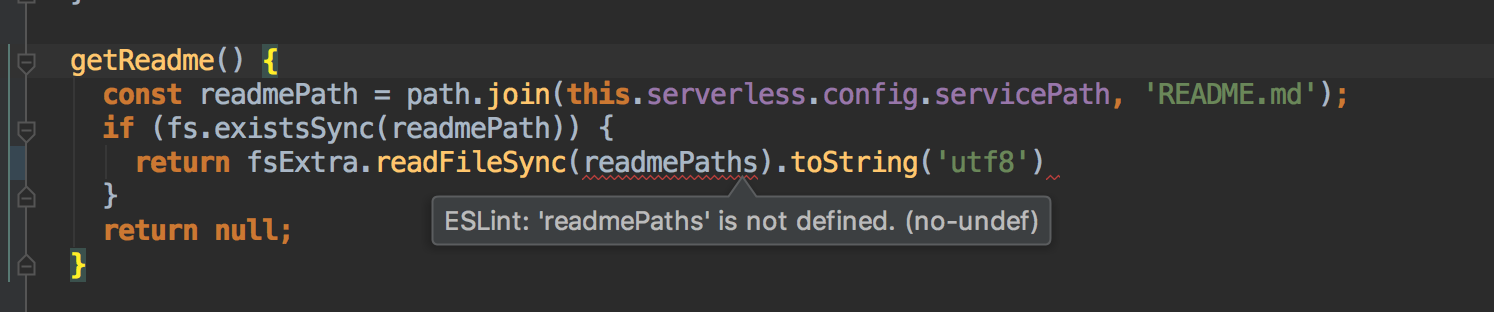
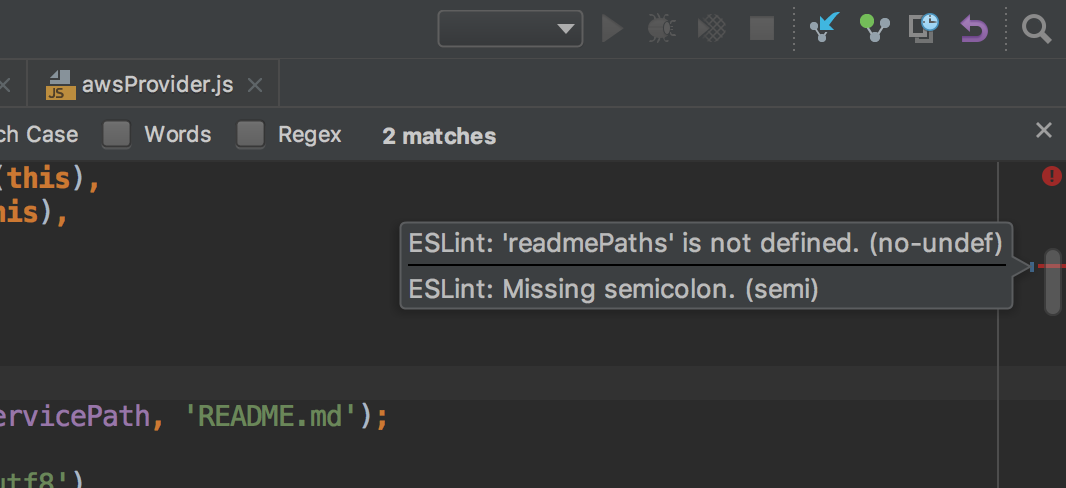
Pretty great, right?
You can use any linter you want, but my personal favorite is the Standard linter. It’s the simplest of them all and provides a zero-config experience.
To set it up on WebStorm, just add it to your devDependencies. WebStorm will detect it and ask you if you’d like to use it as your project linter. To which you say: yes!
Now you’ll need to disable WebStorm default inspections. Open WebStorm Preferences > Editor > Inspections > JavaScript and disable all rules except for the Standard Code Quality Tool.
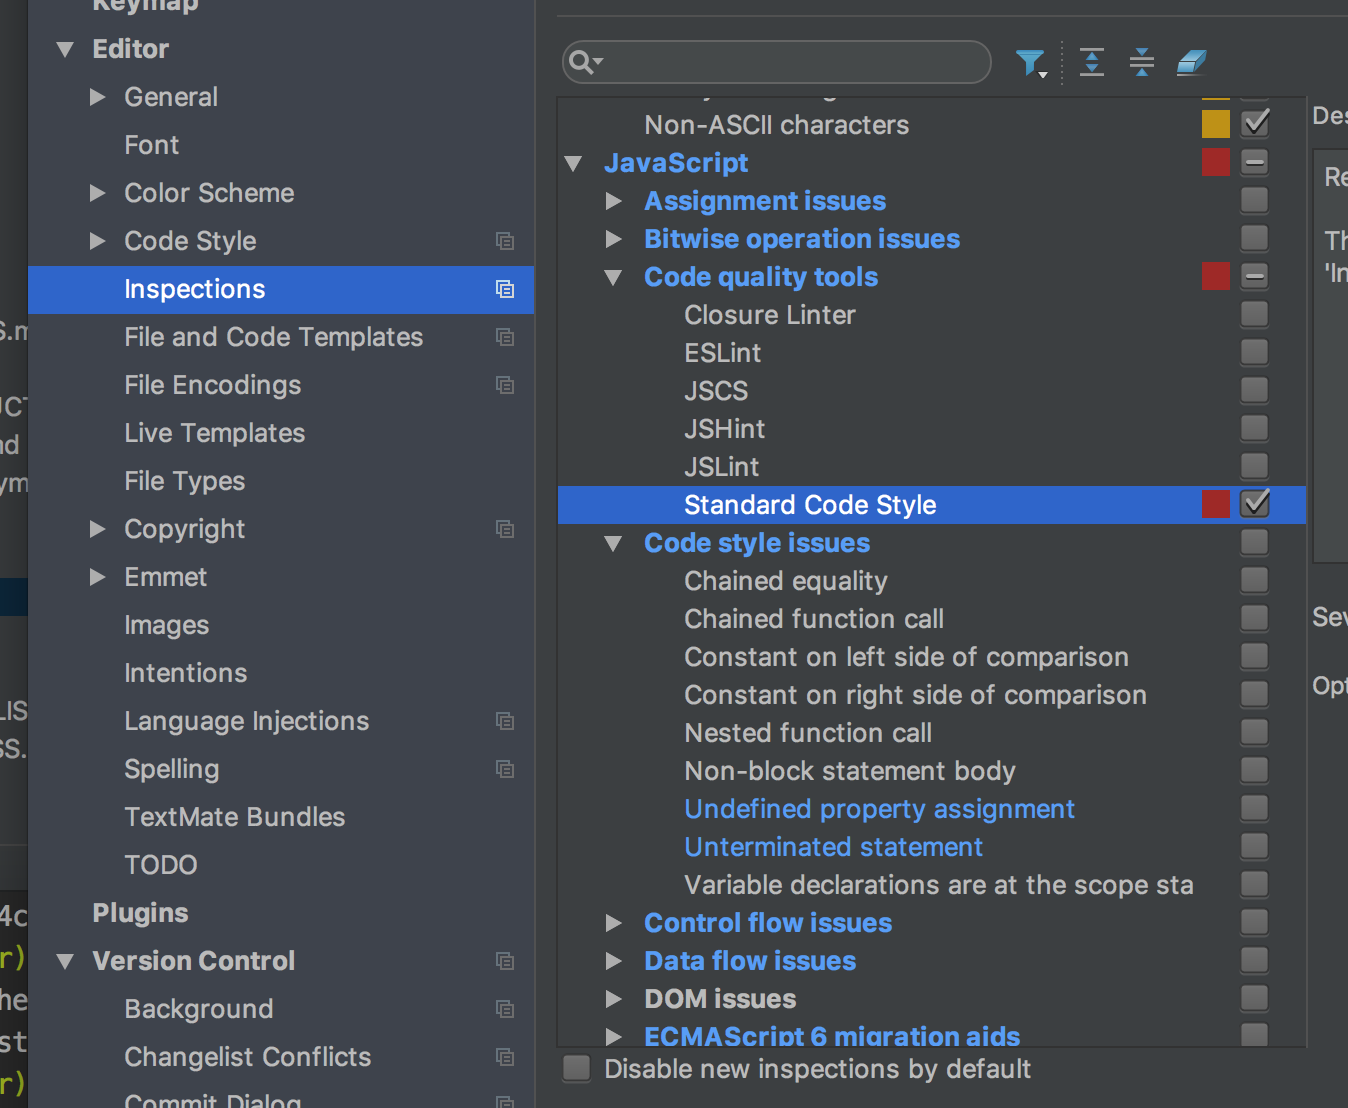
That’s it, you’re done.
Let’s move on to one of my favorites: Live Templates.
Step 2: Start using serverless Live Templates
Live Templates is probably one of WebStorm’s best features. It allows for custom-made auto code completion when you type a trigger keyword.
Here’s an example live template that auto generates a simple function by typing fn + tab:
Amazing. I love this feature.
To set up your own live template, go to WebStorm Preferences > Editor > Live Templates > JavaScript. From there, you can view the built-in templates, see how they work, and create your own.
Integrating with the Serverless Framework
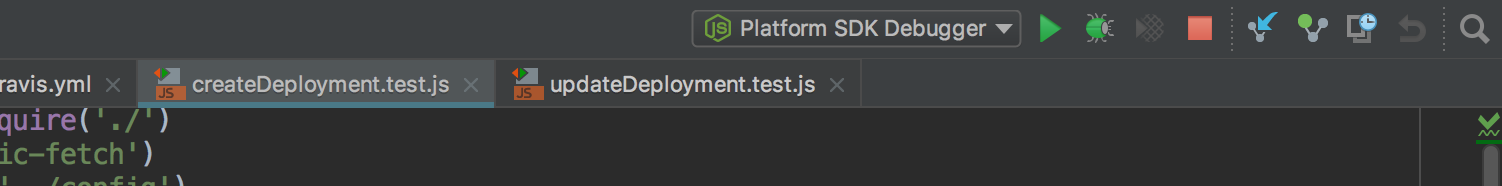
Wouldn’t it be so awesome if you could hit COMMAND + SHIFT + D to instantly deploy your service? That’s what I thought too.
Well, luckily WebStorm allows you to hook up external tools, have them available to the IDE UI, and even assign keyboard shortcuts to them!
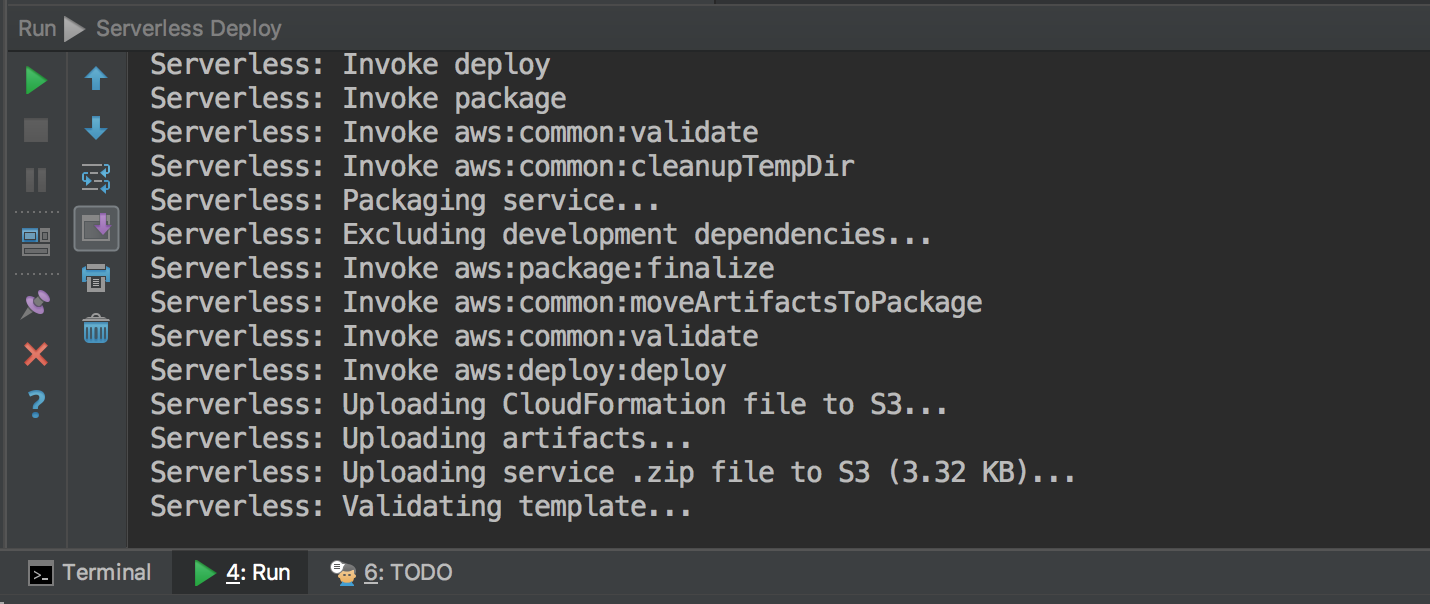
Here’s what this looks like in practice:
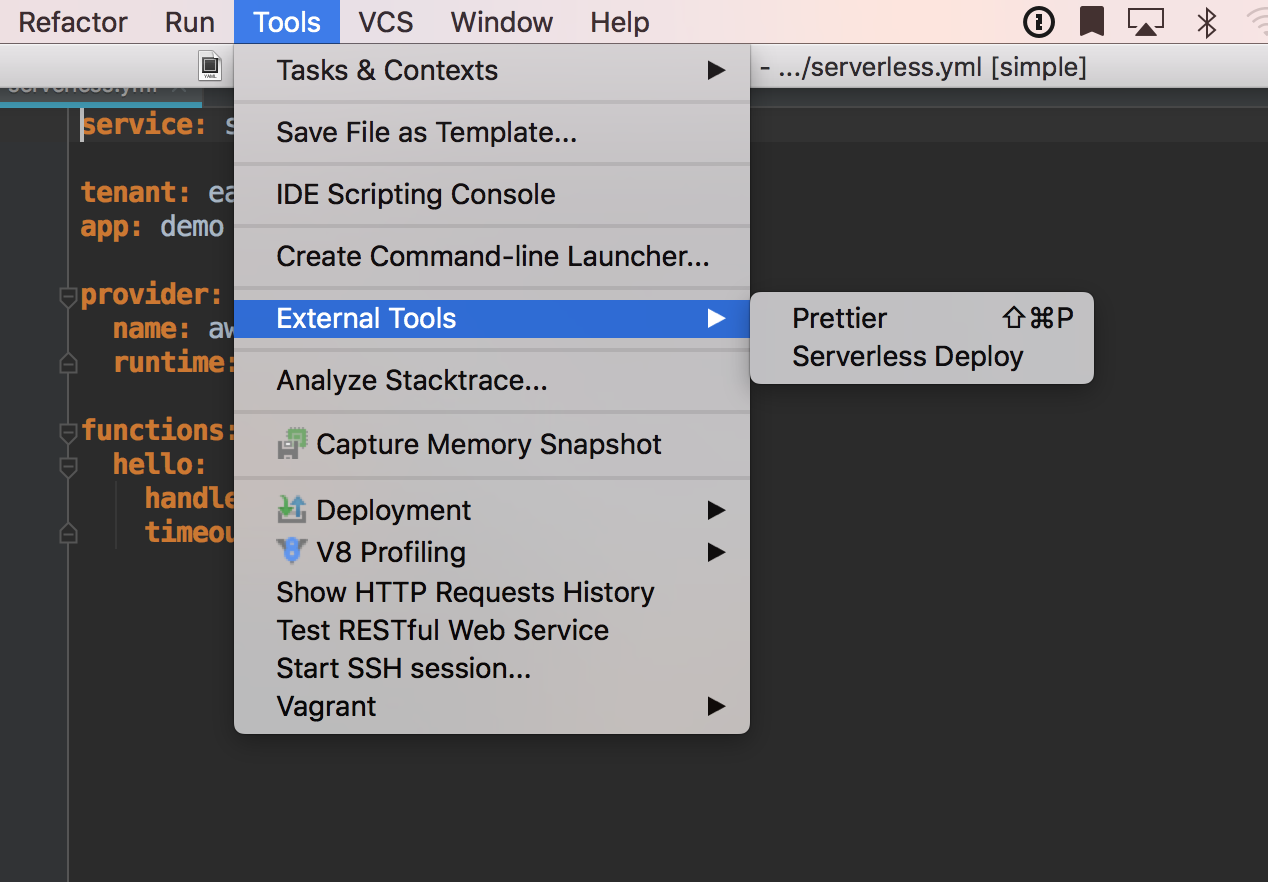
To add the Serverless Framework as an external tool, go to WebStorm Preferences > Tools > External Tools. Click on the + sign at the bottom left, and add the following settings:
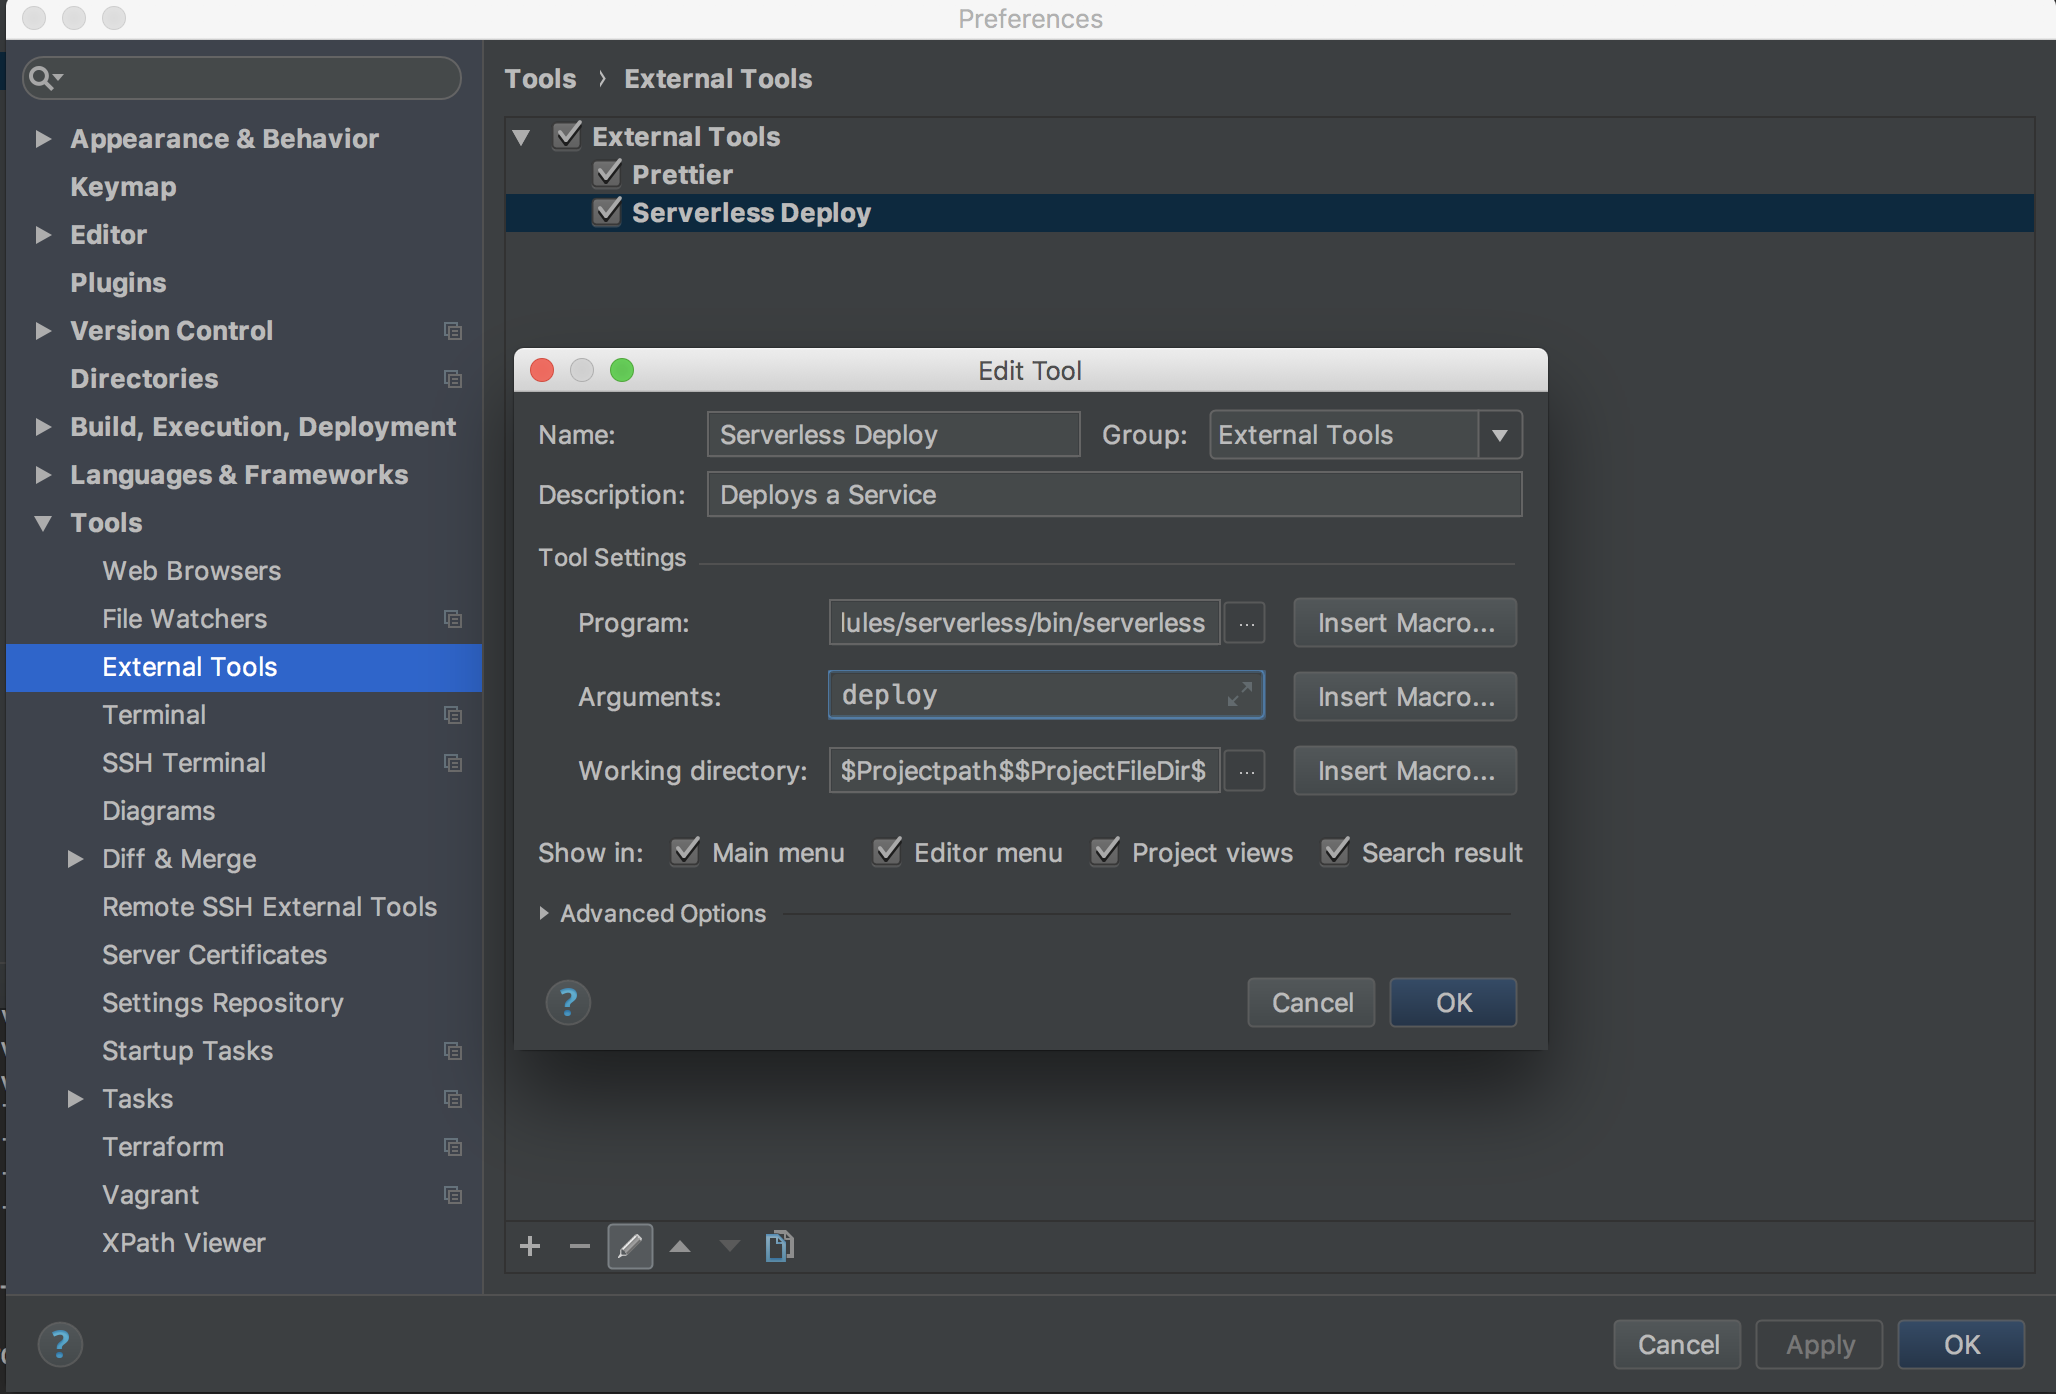
You can follow the same steps if you’d like to add other tasks as well, such as sls invoke.
Step 3: streamline your testing & debugging
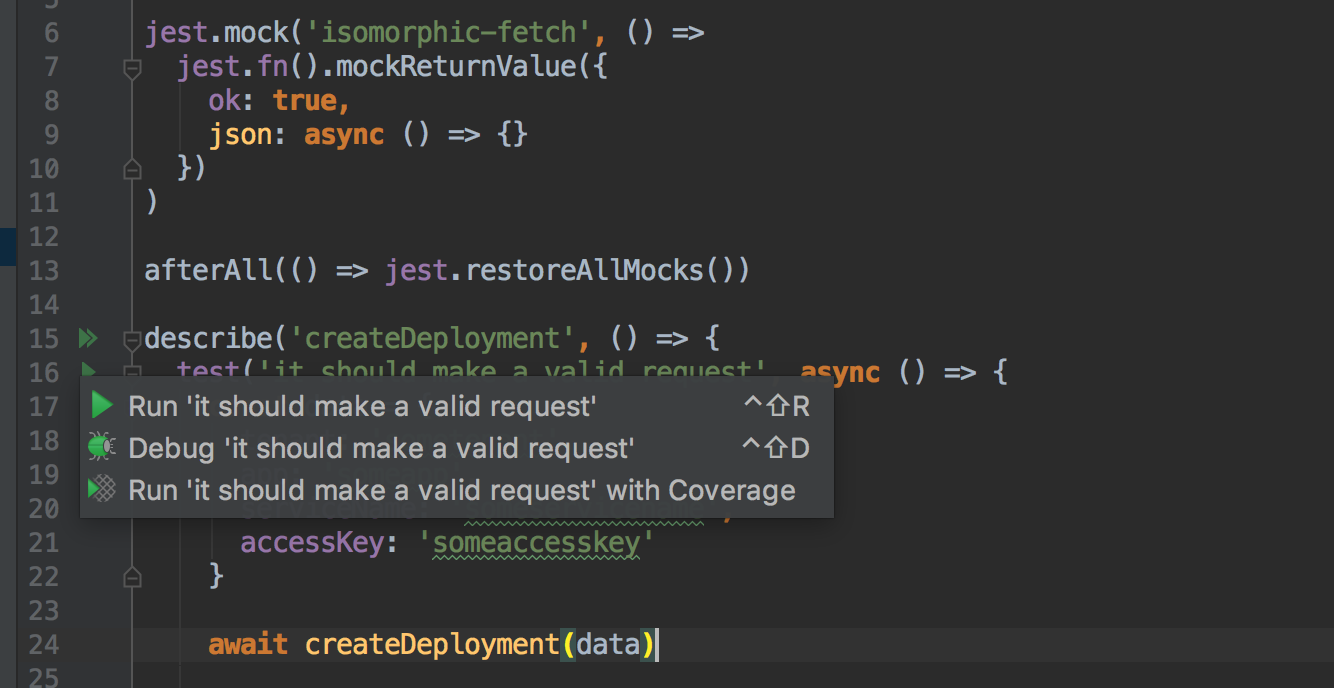
WebStorm comes with first class support for many testing frameworks, including Jest (my personal favorite). This makes it very easy to quickly run individual test cases/suites with a point-and-click interface.
All you have to do is install your favorite testing framework, and WebStorm will detect it.
When it comes to testing my serverless applications, I personally try to aim for around 80% code coverage via unit tests, plus a one or two handler integration tests. Running those tests is a breeze with WebStorm, and they become extra useful when you use them with WebStorm’s built-in debugger.
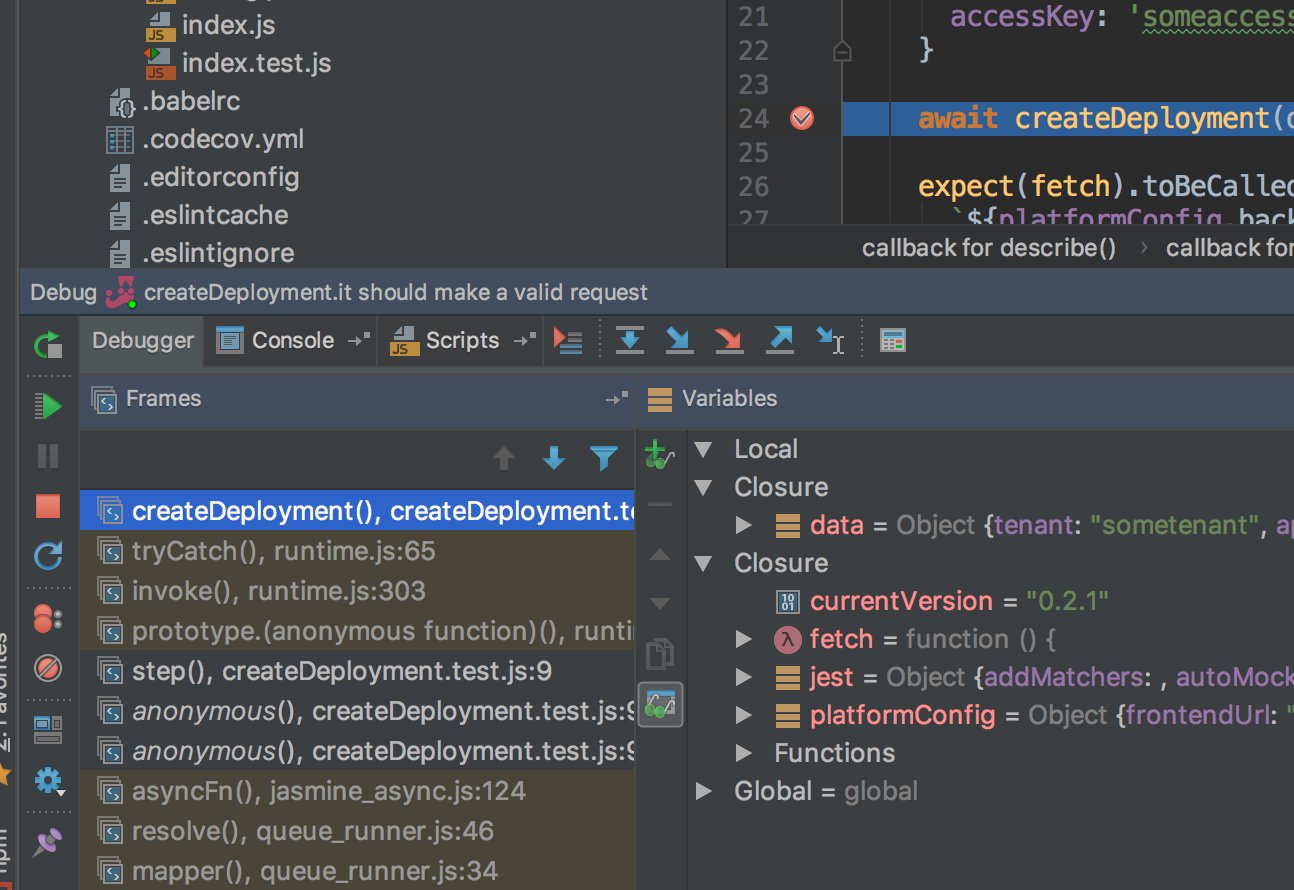
Using the WebStorm debugger
WebStorm’s debugger is powerful. You set it up once, define your break points, then run it.
WebStorm will then show you tons of crucial information and data about your code and its context. Once you get used to this debugger, you’ll probably never use console.log() for debugging again!
Note: I won’t be going deep into how to set up the WebStorm debugger in this post, but you can check out this other walkthrough if you’d like.
Testing serverless REST APIs
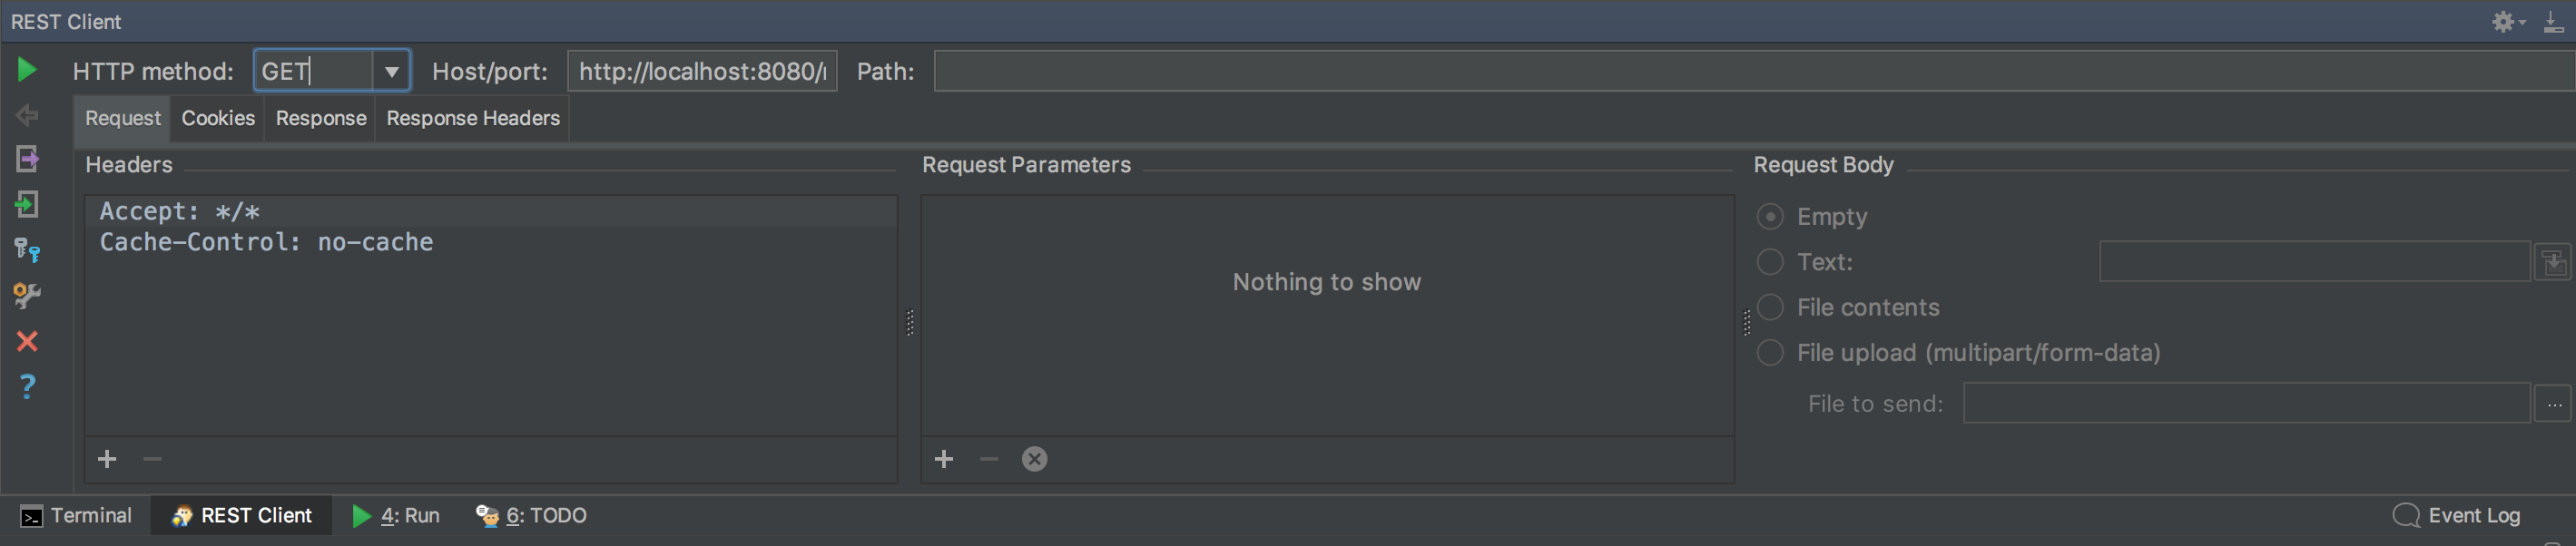
REST APIs are one of the most common use cases for serverless applications. Luckily for us, WebStorm comes in with a built-in REST client that you can use to test your deployed serverless endpoints.
The WebStorm REST client is a lot easier to use than curl. It includes most of what you need right inside your editor, so that you don’t need to use another REST client such as Insomnia or POSTMAN.
Open it by Clicking on Tools > Test RESTful Web Service:
Final Thoughts
This covers the most essential serverless-specific setup for WebStorm. I hope it’s helpful for your workflow!
If you want to get even more advanced or customized, check out the WebStorm docs. They have lots of powerful features you might like. Feel free to share your own setup with me in the comments or on Twitter; I’m always down to learn about ways to make my workflow even more productive.
Don’t forget to set your perfect set of shortcuts, and happy hacking.