
In our last ops post, we set up simple alarms to monitor your Lambda functions with CloudWatch metrics and alarms. This gives you a baseline understanding of what is happening in your functions.
But metrics can only take you so far. When errors are firing and alarms are triggering, you need visibility into how and why your functions are failing.
Enter an old friend of every developer: the log. Logging lets you drop status updates from your code and provide additional detail around errors.
Inspecting logs in a serverless world uses some different patterns -- no SSH-ing onto a production box and grep-ing through text files for you. In this post, we'll talk about the basic logging mechanisms with AWS Lambda and dive into some advanced practices for understanding your functions.
The Basics: Logging to CloudWatch
First, let's start with a walkthrough of how logging works with AWS Lambda. We'll create a Serverless service to test logging. I like to use Python, but the mechanics are similar with Javascript or the other supported languages.
To follow along, you'll need to install and configure the Serverless Framework. Check the instructions here if you haven't done that yet.
First, let's create a simple service to demonstrate logging:
$ sls create -t aws-python3 -p logging
Serverless: Generating boilerplate...
Serverless: Generating boilerplate in "/Users/alexdebrie/scratch/logging"
 _______                             __
|   _   .-----.----.--.--.-----.----|  .-----.-----.-----.
|   |___|  -__|   _|  |  |  -__|   _|  |  -__|__ --|__ --|
|____   |_____|__|  \___/|_____|__| |__|_____|_____|_____|
|   |   |             The Serverless Application Framework
|       |                           serverless.com, v1.19.0
 -------

Serverless: Successfully generated boilerplate for template: "aws-python3"
$ cd logging
$ ls
handler.py	serverless.yml
We used the create command to create a Python3 service from a template, then changed into our directory which contains a serverless.yml config file and a handler.py file with our function code.
Open your handler.py file and add the following code:
# handler.py

import json
import logging


logger = logging.getLogger()
logger.setLevel(logging.INFO)


def hello(event, context):

    print('I can log with a Python print statement.')

    logger.info('I can also log with the Python logging library.')

    response = {
        "statusCode": 200,
        "body": json.dumps({'message': 'I did some logging.'})
    }
    return response
After you update your handler, deploy your function:
$ sls deployThen invoke your function with the --log flag to display the logging output to your terminal:
$ sls invoke -f hello --log
{
    "statusCode": 200,
    "body": "{\"message\": \"I did some logging.\"}"
}
--------------------------------------------------------------------
START RequestId: 29505d9b-93d1-11e7-8418-5f5a64c6f12a Version: $LATEST
I can log with a Python print statement.
2017-09-07 13:33:41.102 (+00:00)	29505d9b-93d1-11e7-8418-5f5a64c6f12a	[INFO]	I can also log with the Python logging library.
END RequestId: 29505d9b-93d1-11e7-8418-5f5a64c6f12a
REPORT RequestId: 29505d9b-93d1-11e7-8418-5f5a64c6f12a	Duration: 0.37 ms	Billed Duration: 100 ms 	Memory Size: 1024 MB	Max Memory Used: 21 MB
In the logs, we can see two logging statements. The first is from the print statement with just the bare message passed in. The second is from the logger and includes formatting such as a timestamp, the RequestId, the log level, and the log message. Either method will work. Both will be captured by CloudWatch without adding significant latency to your functions.
This is similar for other runtimes. For example, in Node, use console.log() for logging to CloudWatch.
Viewing your logs
If you're actively developing a function, the fastest way to view your logs is with the Serverless Framework itself. As shown above, you can invoke a function and get logs for that specific invocation:
$ sls invoke -f <function> --log
...log output...
Or you can use the sls logs command to get logs for many invocations:
$ sls logs -f <function>
...log output...
Pro tip: Open a different window in your terminal and run sls logs -f <function> --tail. The --tail flag will continuously poll your function's log group, so you can stream in logs as you invoke your function with different input.
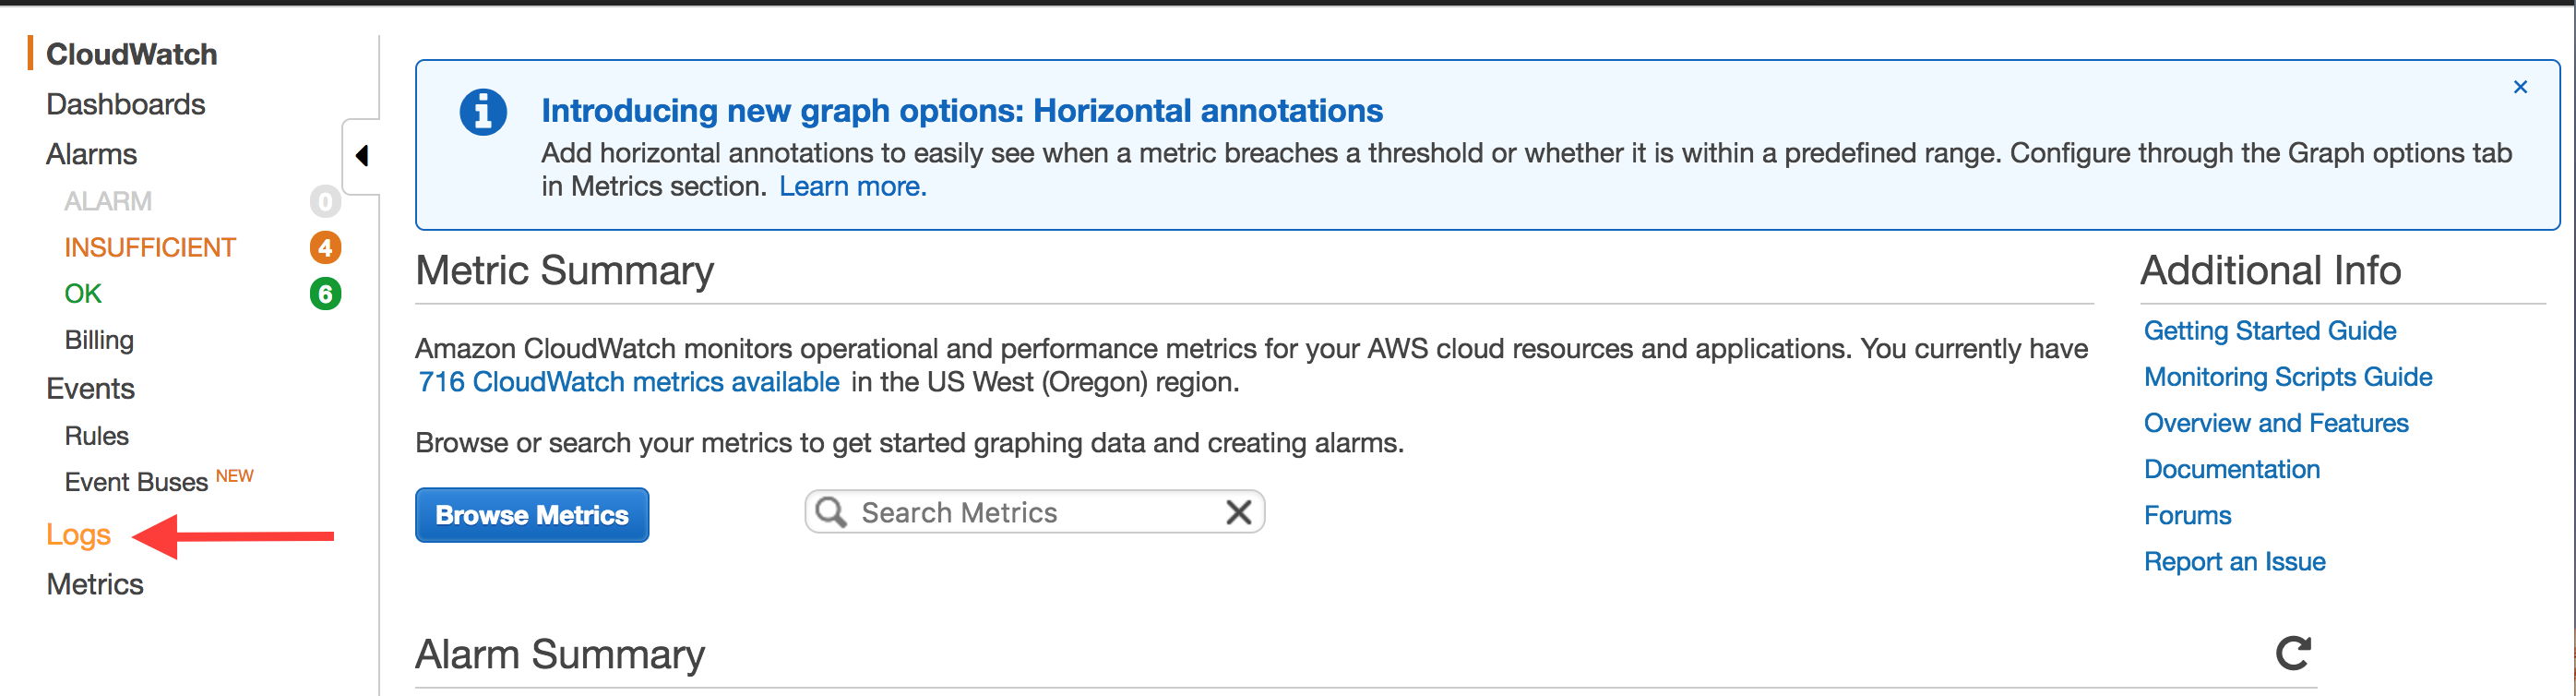
If you're looking to search a larger portion of your logs, you can use the CloudWatch Console. Make sure you're in the right region for your function, then click on "Logs":
This will show all of your Log Groups in the region. Use the search box to filter to the function you want. By default, the group will be named /aws/lambda/<service>-<stage>-<function>
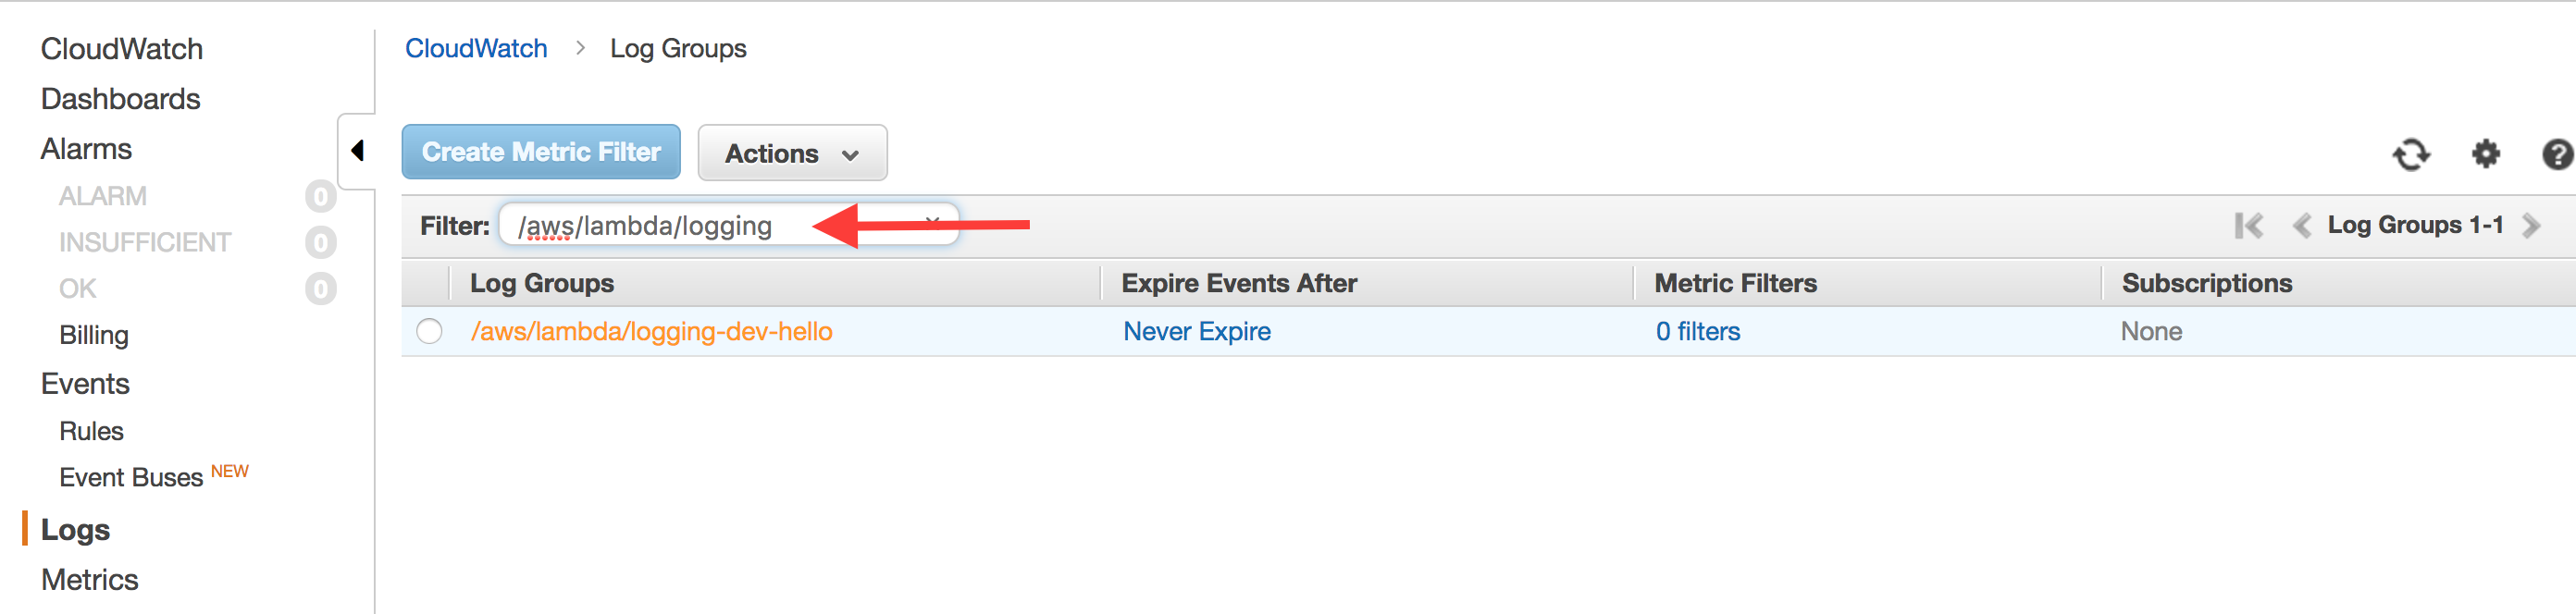
Click on your Log Group. You will see a list of Log Streams listed. Each function "container" that spins up for your function will get its own Log Stream, but they will all feed into the same Log Group. If you want to look at logs across all instances of your function, click "Search Log Group".
You'll see a screen like the following:
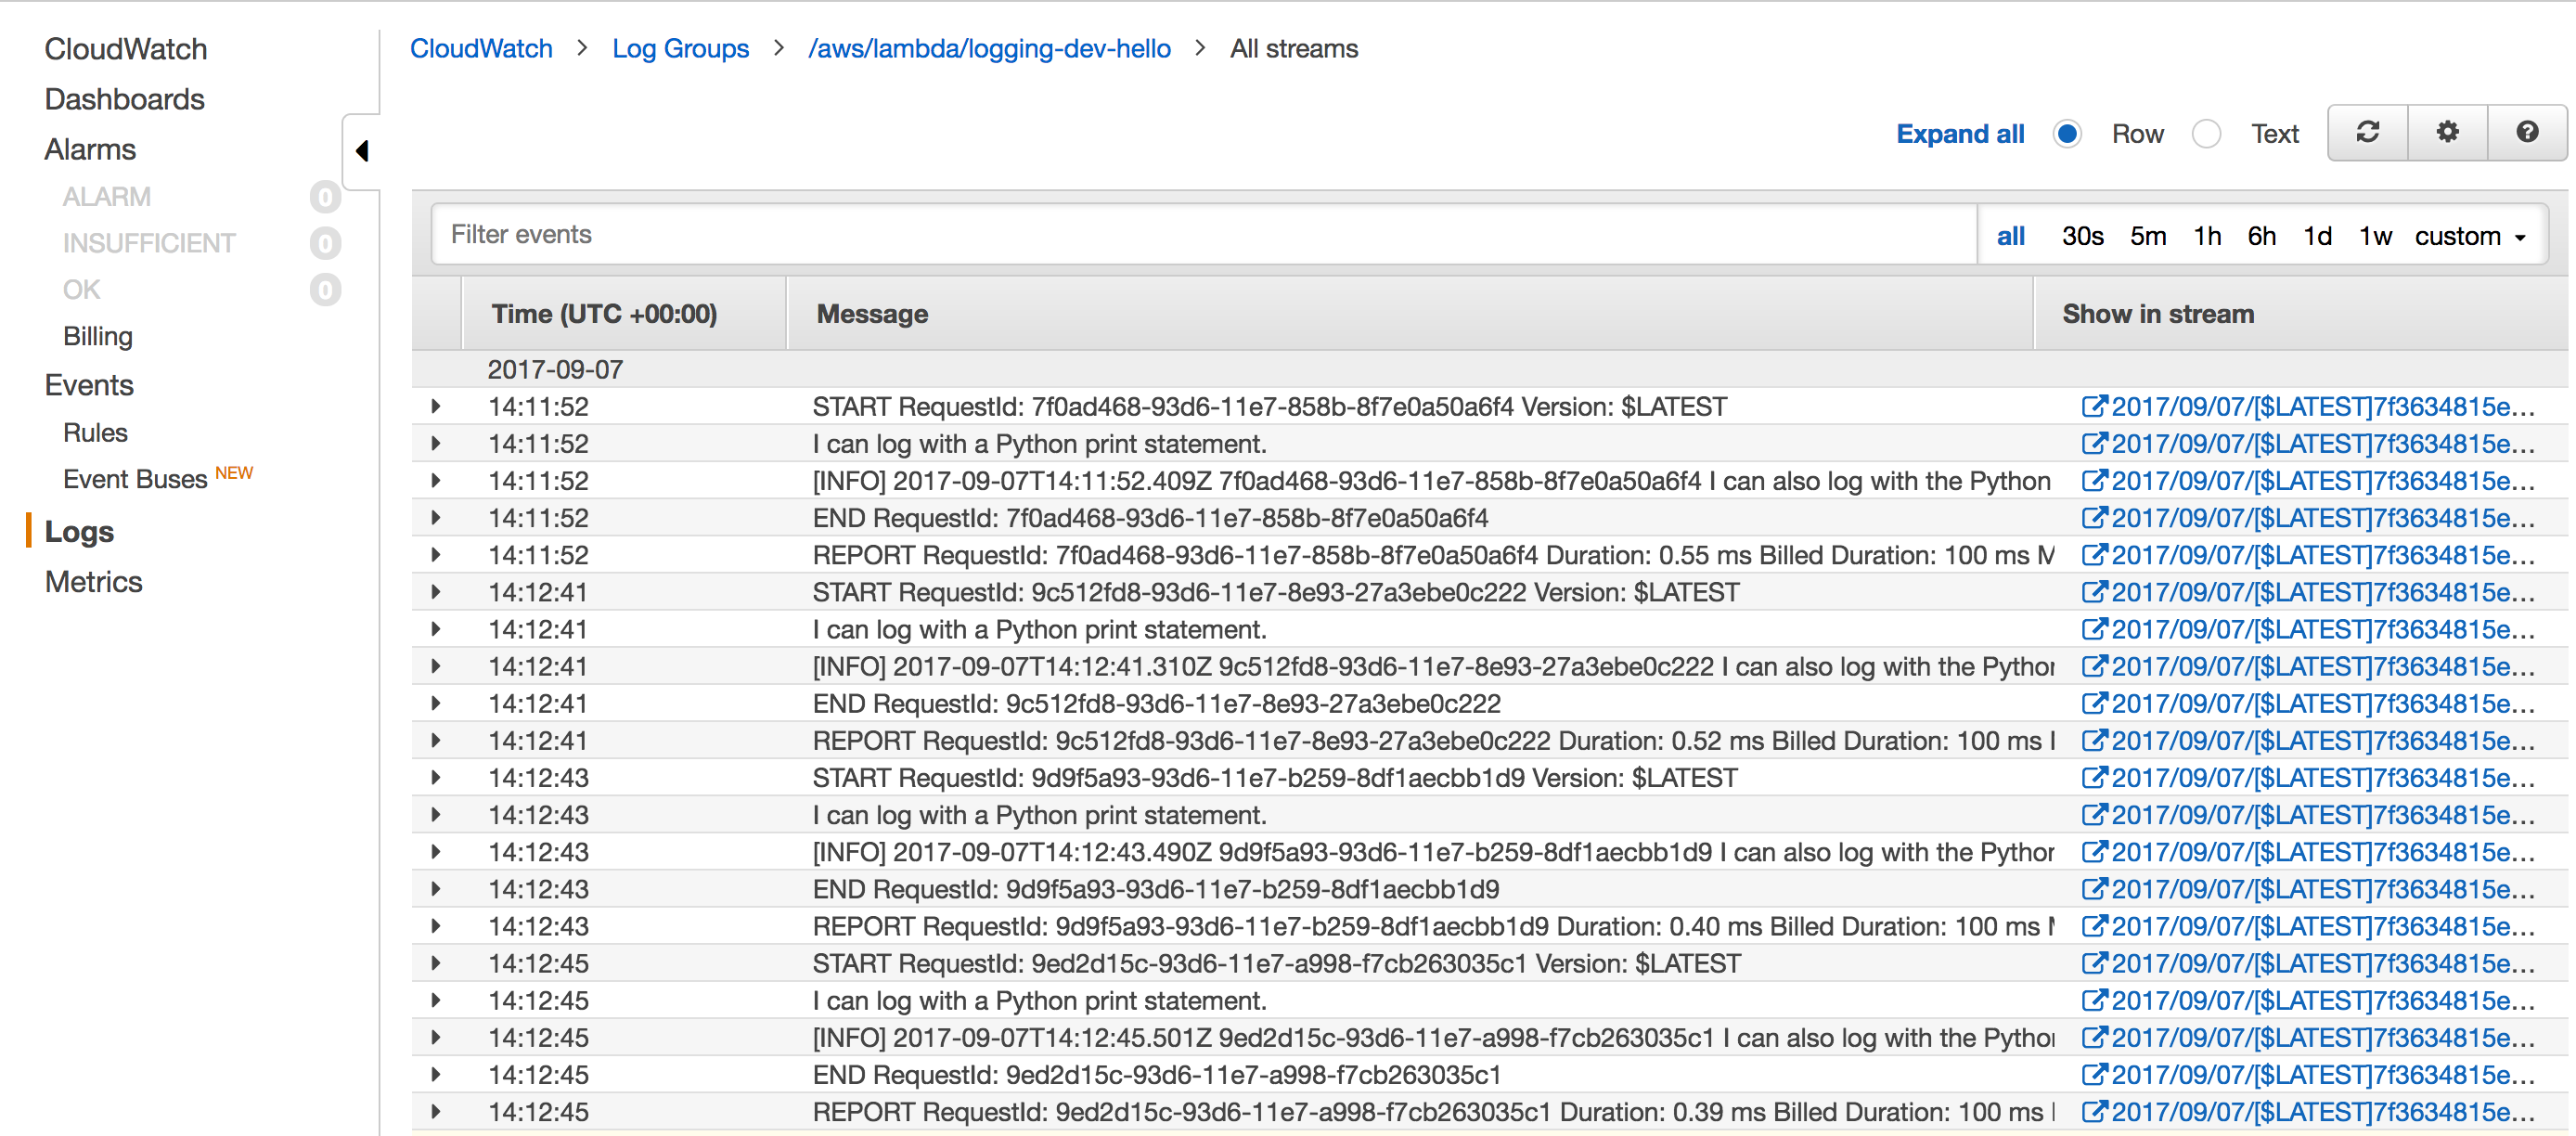
This has all of your function's logs. In addition to your log statements, it contains Lambda output such as when a request has started, when a request has ended and a report of the resources used by that request invocation.
The Lambda logs usually aren't useful for debugging, so I filter them out at the top with -"RequestId: ", which means "remove all logs that have the string "RequestId: " in them.
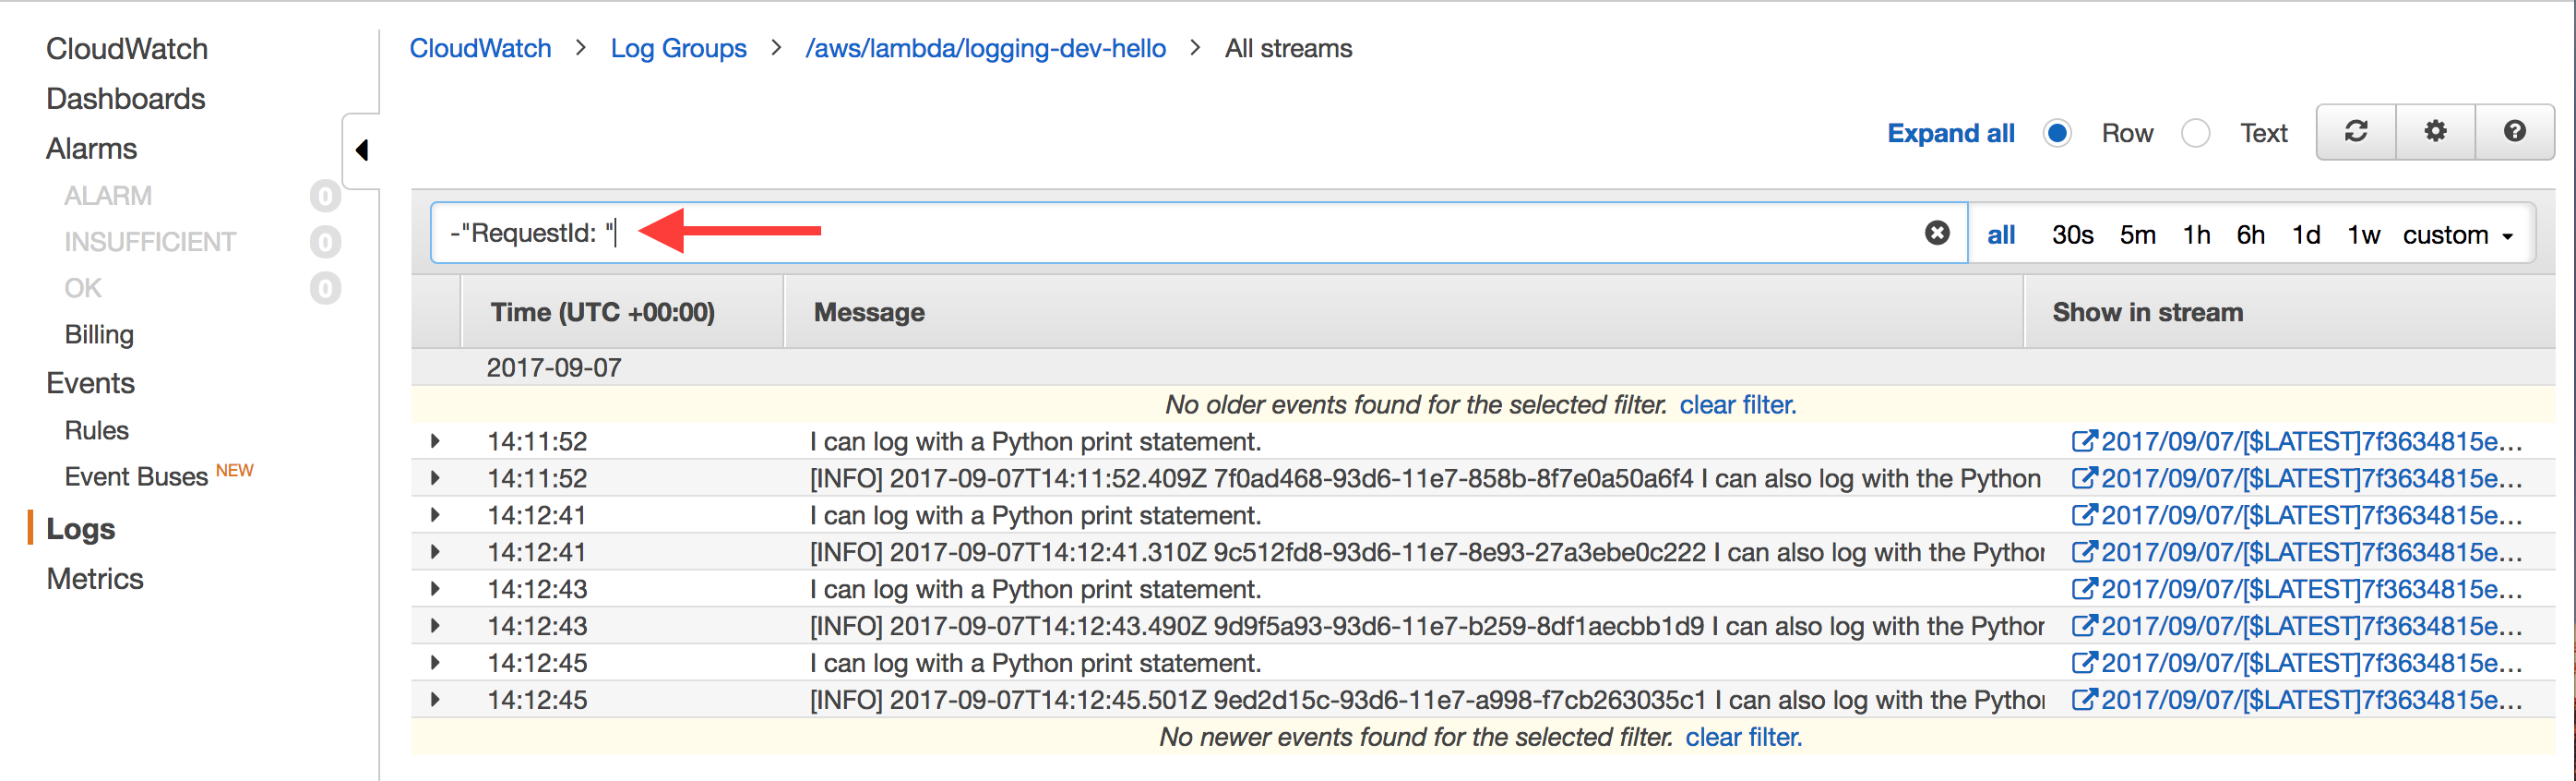
Once you've done that, it's easier to browse your logs for the information you want.
Advanced Usage: Centralized Logging
The terminal and CloudWatch console are fine for small-scale debugging purposes, but they quickly break down. If you're looking through high volumes of log messages or correlating errors across multiple Lambda functions, you'll be pulling your hair out with the CloudWatch console.
At this point, you should move to a log aggregator. There are a number of options out there -- Splunk, SumoLogic, Loggly, LogDNA, etc. The particular choice doesn't matter, as long as it has a way to ship logs in via HTTP.
AWS allows you to invoke a Lambda function whenever a particular Log Group receives a new log. This means you can have a log forwarding Lambda function whose sole purpose is to take CloudWatch logs and send them to your central aggregator for inspection and debugging.
To get started, you should first deploy a Serverless service with your log forwarding function. Your serverless.yml should be similar to:
# serverless.yml

service: log-forwarder

provider:
  name: aws
  runtime: nodejs6.10
  stage: prod
  region: us-east-1
  timeout: 30
  memorySize: 128

functions:
  forwarder:
    handler: handler.handler

resources:
  Resources:
    ForwarderLambdaPermission:
      Type: "AWS::Lambda::Permission"
      Properties:
        Action: "lambda:InvokeFunction"
        FunctionName:
          Fn::GetAtt:
            - ForwarderLambdaFunction
            - Arn
        Principal: logs.${self:provider.region}.amazonaws.com
Your service should have a handler.js file which takes a CloudWatch log input and forwards it to your aggregator service. If you need examples, some aggregator services have built these functions for you:
Once you have your handler, run sls deploy to put your forwarding function into production. Then, get the ARN of your Lambda using sls info -v:
$ sls info -v

Service Information
service: log-forwarder
stage: prod
region: us-east-2
api keys:
  None
endpoints:
  None
functions:
  forwarder: log-forwarder-prod-forwarder

Stack Outputs
ForwarderLambdaFunctionQualifiedArn: arn:aws:lambda:us-west-2:111111111111:function:log-forwarder-prod-forwarder:1
ServerlessDeploymentBucketName: log-forwarder-prod-serverlessdeploymentbuck-9asdfjasoir1
In the StackOutput section, there's a ForwarderLambdaFunctionQualifiedArn. Copy this, and remove the :<number> at the very end. The number is the version, which you shouldn't worry about.
Now that you have a log forwarding function, you can subscribe that function to the CloudWatch Log Groups of your other services. The easiest way to do so is with the serverless-log-forwarding plugin from Amplify Education.
To use it, go to your Serverless service whose logs you would like to forward. Then, install the serverless-log-forwarding plugin:
$ npm install --save-dev serverless-log-forwardingThen, add the forwarding configuration to your serverless.yml:
# serverless.yml

plugins:
- serverless-log-forwarding

custom:
  logForwarding:
    destinationARN: <forwarding-function-ARN>
    filterPattern: "-\"RequestId: \""
Use the ARN from your log forwarding function previously as the destinationARN. The filterPattern is optional, but I use it to filter out the internal Lambda logs as shown in the CloudWatch console walkthrough.
Once you sls deploy your function, your CloudWatch Log Groups will be wired up to send to your forwarding function to be shipped to your log aggregator!
Additional Reading
Yan Cui recently did an excellent series on managing CloudWatch logs with Lambda. He goes further in depth with logging, including using correlation Ids to trace requests across function boundaries. Yan is an excellent resource on Lambda in general, having managed some large Lambda-backed deployments at Yubl. His series on Yubl's road to Serverless architecture is well worth reading.


