
Overview
You may have seen recent news that IOpipe was acquired by New Relic. As part of that process, IOpipe customers have to make changes in the next 30 days to get any form of monitoring on their applications before New Relic sunsets the old product.
So what better time to try the Serverless Dashboard for free? You'll get automatically-instrumented monitoring that requires no changes to your current function code along with CI/CD, deployment safeguards and more.
With a quick account sign up and a two line change to your existing serverless.yml file you can setup monitoring (and other features!) for all your Serverless Framework services written in Node or Python for AWS.
Interested? Let's see how to do it.
Step 0 - Prerequisites and Assumptions
I'm going to assume that:
- You're using the Serverless Framework CLI v1.48.0 or later to deploy your applications
- You have AWS keys configured locally that you use to deploy your services
- You're ready to remove IOpipe (as it will soon be unsupported)
Step 1 - Signing Up for Serverless Framework Pro (For Free!)
Serverless Framework Pro is free to use for up to a million monthly Lambda function invocations. Just create a dashboard account here.
During the account creation process all you need to do is create an app and call it something related to the services you're trying to instrument. As part of this process you'll also create an org but more on that in a moment.
Step 2 - Configuring Your Service
After you've created the account successfully, you can navigate into your service directory and open up your serverless.yml. At the top of the file add these two lines:
org: theorgname
app: myappname
An org is an organization that your applications and services are contained within. You can have multiple orgs or just one. You can also use organizations to help manage different teams with different levels of access to different services.
The app is the applications that your services will be contained within. This might be a particular new product, or services that are somewhat related to each other. But think of this as an easy way to group Serverless Framework services together in a logical way.
You will need to replace theorgname above with the name of your organization. To get that value you can click the upper right dropdown menu in the Serverless Dashboard and look for the value listed under "Current Org". You can also check the URL bar when signed into the dashboard and you should see the organization name right after /tenants/ in the URL.
To get the app name, you can either use the name of the application you just created in Step 1 or you can create a new one with a name to match whatever application you're about to deploy.
Step 3 - Deploy Your Service
After finishing Step 2, go ahead and try running the serverless login command. This should prompt you to login to the Serverless Dashboard and then automatically configure some access keys locally on your machine to deploy using the Dashboard. If you have any trouble with this make sure to upgrade your version of the Serverless Framework and feel free to take a look at the Getting Started guide.
When this command completes you should be all set to run serverless deploy in your service directory and deploy your new service to AWS along with all the monitoring and debugging tools already baked into Serverless Framework Pro.
When running serverless deploy don't be alarmed if you see a few new outputs or warnings in a Safeguards section - those are some of the automatically instrumented features that you're getting to help you align with serverless deployment best practices.
Step 4 - Monitor Your Service
Then just test your function with serverless invoke or something like Postman to test out HTTP API endpoints. Once you fire off your first invocation after this new deployment just open up the Serverless Dashboard and review the function.
Navigate into the application you just deployed your service in (the app value). You can do this by clicking on the tile for that application. For example - the backup-app in this screenshot:

Then, under the service name (in this case demo-email-form-backup) click the stage you just deployed to (be default the Serverless Framework deploys to the dev stage).

After this, you'll have a lot of options to monitor the service, configure notifications, review automatically-generated alerts, and review deployment history. But to review the recent function invocation just click the explorer tab:

From there, you'll be able to use the invocations explorer to review all of your function invocations. If your function has only run once (with that single invocation from earlier) then you'll probably only see one of the function invocations below. But you can use this view to sort through massive numbers of Lambda invocations to find the ones you're looking for using powerful search filters to find specific kinds of errors or other characteristics that you might be looking for.

When you click on the invocation you're debugging, you'll automatically have a variety of debugging information included. A bunch of the function metadata, memory utilization, tracing information for any AWS SDK calls or HTTP requests from common HTTP libraries, and the raw CloudWatch log details.

You can use these details to help debug and optimize your functions. In the invocation above, for example, I might realize that I need to optimize a long-running HTTP call and see if there are ways for me to migrate to a better API provider or, if I manage the API behind that call, if I can optimize that service further.
For invocations that fail, you'll also get automatic details about the error including a stacktrace to help direct you to the location of the failure in your code.
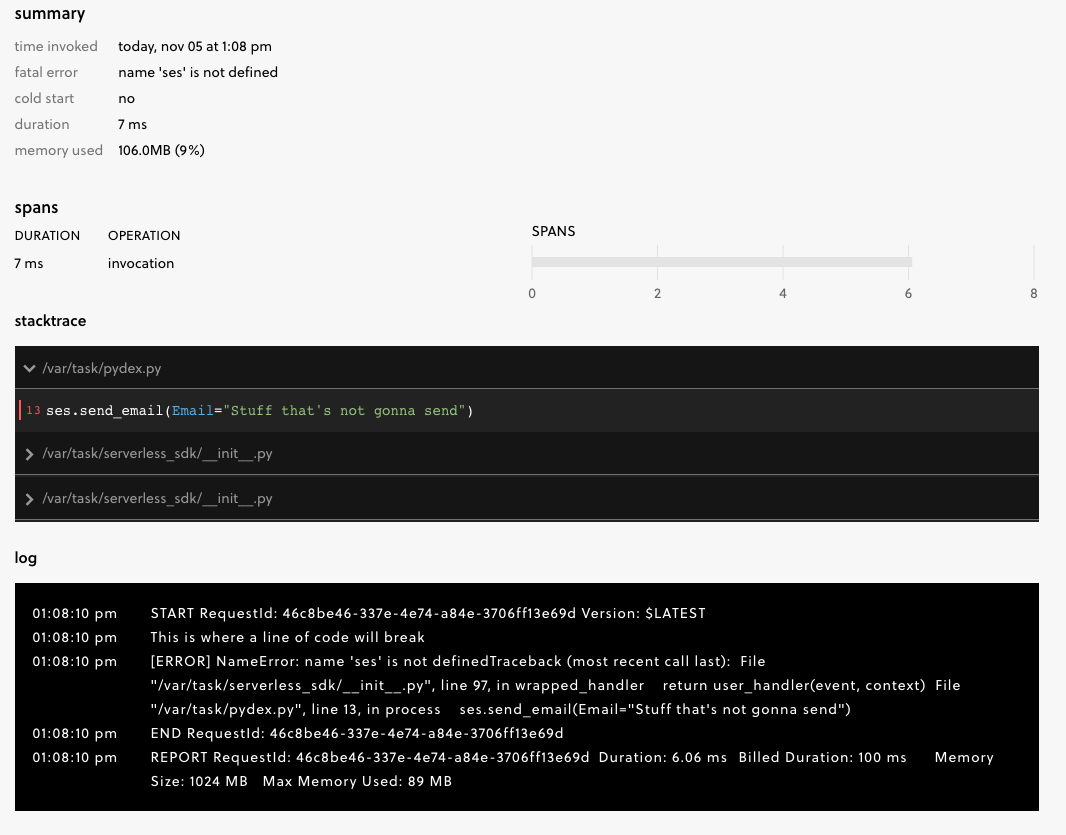
The stack trace can help you jump immediately to the issue, fix it quickly, and move on with your development.
Conclusions
A migration from a core development tool like a monitoring solution can be tough, but we think that for those already working with the Serverless Framework that this is one of the easiest ways to get out-of-the-box monitoring and more for your applications.
We're always trying to think about how the features we build can help meet your development needs and save you time previously stuck debugging. Have a question about how we compare to IOpipe or want more details? Leave a comment below or take a look at all the features included in Serverless Framework Pro.